Z Score Percentile Chart
A percentile rank says what percentage of values fall below yours — and a z score says the same thing in standard deviations. This chart converts between them for every z from −3.5 to +3.5: find your z, read your percentile. z = 0 is the 50th percentile, z = 1.96 is the 97.5th, and z = −1.645 is the 5th.
| z | Percentile | z | Percentile |
|---|---|---|---|
| -3.5 | 0.0 | -3.4 | 0.0 |
| -3.3 | 0.0 | -3.2 | 0.1 |
| -3.1 | 0.1 | -3.0 | 0.1 |
| -2.9 | 0.2 | -2.8 | 0.3 |
| -2.7 | 0.3 | -2.6 | 0.5 |
| -2.5 | 0.6 | -2.4 | 0.8 |
| -2.3 | 1.1 | -2.2 | 1.4 |
| -2.1 | 1.8 | -2.0 | 2.3 |
| -1.9 | 2.9 | -1.8 | 3.6 |
| -1.7 | 4.5 | -1.6 | 5.5 |
| -1.5 | 6.7 | -1.4 | 8.1 |
| -1.3 | 9.7 | -1.2 | 11.5 |
| -1.1 | 13.6 | -1.0 | 15.9 |
| -0.9 | 18.4 | -0.8 | 21.2 |
| -0.7 | 24.2 | -0.6 | 27.4 |
| -0.5 | 30.9 | -0.4 | 34.5 |
| -0.3 | 38.2 | -0.2 | 42.1 |
| -0.1 | 46.0 | +0.0 | 50.0 |
| +0.1 | 54.0 | +0.2 | 57.9 |
| +0.3 | 61.8 | +0.4 | 65.5 |
| +0.5 | 69.1 | +0.6 | 72.6 |
| +0.7 | 75.8 | +0.8 | 78.8 |
| +0.9 | 81.6 | +1.0 | 84.1 |
| +1.1 | 86.4 | +1.2 | 88.5 |
| +1.3 | 90.3 | +1.4 | 91.9 |
| +1.5 | 93.3 | +1.6 | 94.5 |
| +1.7 | 95.5 | +1.8 | 96.4 |
| +1.9 | 97.1 | +2.0 | 97.7 |
| +2.1 | 98.2 | +2.2 | 98.6 |
| +2.3 | 98.9 | +2.4 | 99.2 |
| +2.5 | 99.4 | +2.6 | 99.5 |
| +2.7 | 99.7 | +2.8 | 99.7 |
| +2.9 | 99.8 | +3.0 | 99.9 |
| +3.1 | 99.9 | +3.2 | 99.9 |
| +3.3 | 100.0 | +3.4 | 100.0 |
| +3.5 | 100.0 |
Percentiles here are rounded to one decimal for chart readability; the finder on the z score table returns any z to two decimals. Between chart rows, percentiles move smoothly — z = 1.25 (89.4th) sits between the 1.2 and 1.3 rows exactly as you would expect.
How the conversion works
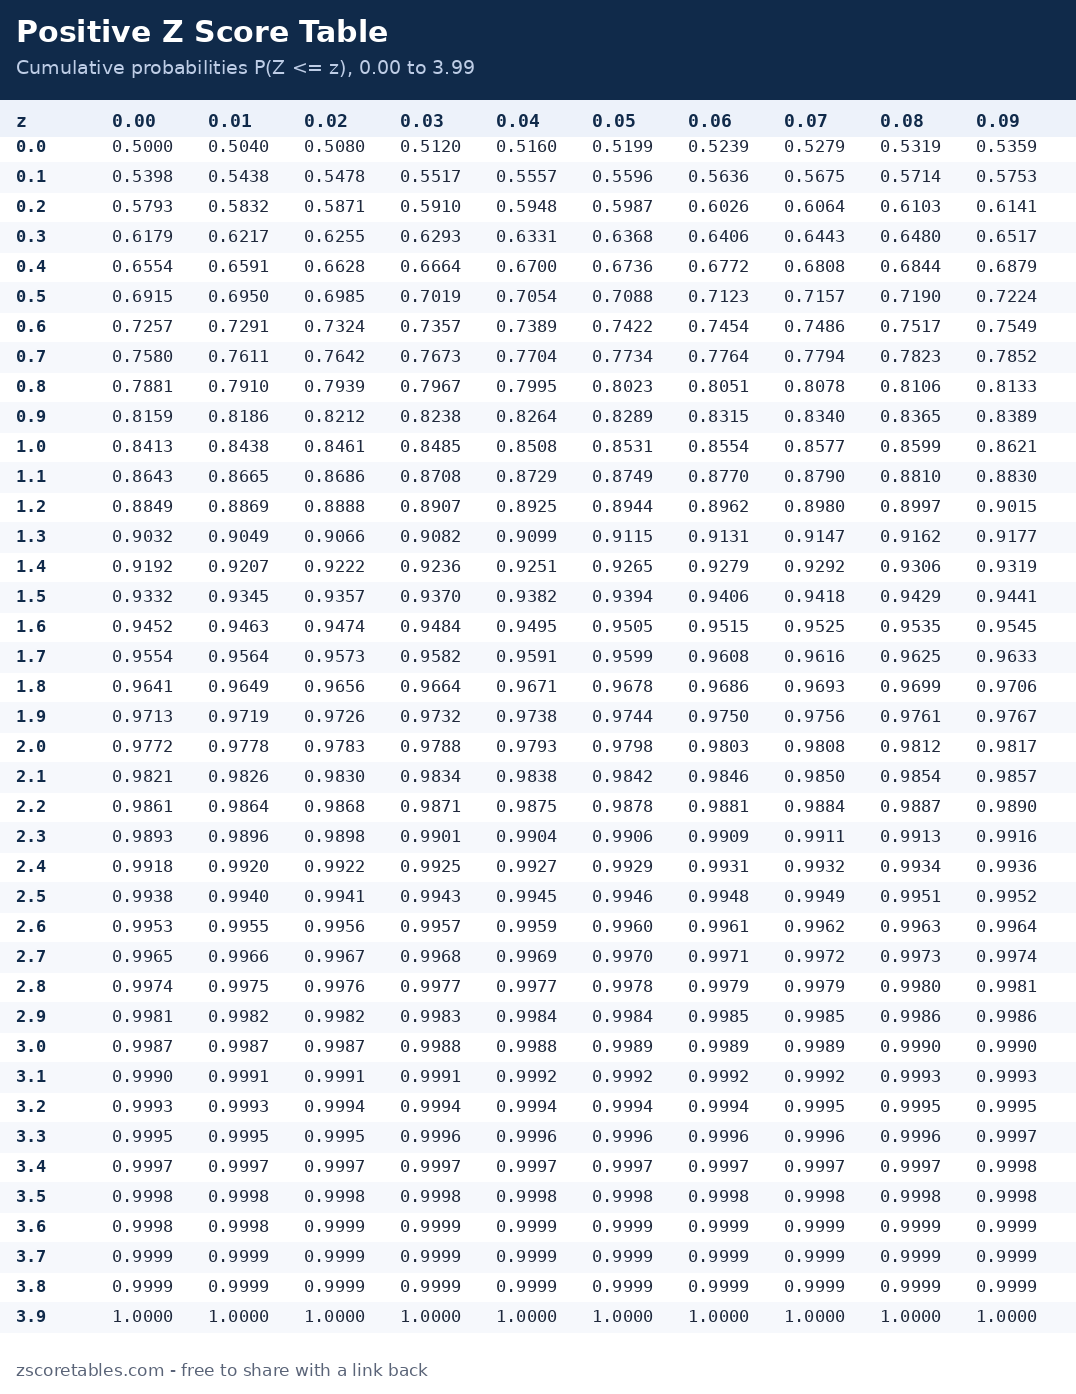
There is no separate percentile formula to memorise, because a percentile is a cumulative probability wearing a percentage sign. Percentile of z = Φ(z) × 100, where Φ is the same table entry you have been reading all along. z = 1.00 → 0.8413 → the 84.13th percentile, reported as the 84th. Going the other way — percentile to z — is a reverse table lookup: the 95th percentile means Φ(z) = 0.95, and the z that satisfies it is 1.645. The chart above is for reading at a glance; for percentiles between rows, or z scores between tenths, use the calculator's reverse lookup, which interpolates exactly.
The landmarks worth knowing by heart
- z = −2.576 → 0.5th percentile. Only 1 in 200 values falls lower.
- z = −1.96 → 2.5th percentile. The lower fence of the middle 95%.
- z = −1.645 → 5th percentile. The classic "bottom 5%" cutoff.
- z = −1.00 → 15.87th percentile. One standard deviation below the mean.
- z = −0.674 → 25th percentile. The first quartile, Q1.
- z = 0 → 50th percentile. The median and the mean coincide on this curve.
- z = +0.674 → 75th percentile. The third quartile, Q3. The middle half of all values lives between z = −0.674 and +0.674.
- z = +1.00 → 84.13th percentile. Note the asymmetry students miss: +1σ is the 84th percentile, not the 68th — 68% is the share between −1 and +1 together.
- z = +1.645 → 95th percentile · z = +1.96 → 97.5th · z = +2.576 → 99.5th. The mirror images of the lower cutoffs, and the same numbers as the confidence-interval critical values — one set of landmarks, three jobs.
Worked lookups
Example 1 — an aptitude score at z = 0.67
The chart's 0.6 and 0.7 rows read 72.6 and 75.8; the exact cumulative value for 0.67 is 0.7486, so the score sits at about the 75th percentile — three quarters of candidates scored at or below it. Admissions and hiring reports phrase this as "scored better than 75% of the reference group", which is the same statement in words.
Example 2 — which z is needed for the top 10%?
Top 10% means the 90th percentile: Φ(z) = 0.90. Scanning the chart for 90.0 lands between z = 1.2 (88.5) and z = 1.3 (90.3); the exact answer is z = 1.282. On an exam with mean 70 and standard deviation 10, the top-10% threshold is X = 70 + 1.282 × 10 = 82.8 — a mark of 83 or better.
Example 3 — a growth-chart reading at the 15.87th percentile
A child's measurement converts to z = −1.00 on a reference chart, the 15.87th percentile: about 16 of every 100 children of the same age measure lower. Percentile language dominates growth and test reporting precisely because "15.87th percentile" communicates instantly, while "one standard deviation below the mean" makes most readers stop and decode. The numbers are identical; only the audience differs.
Z score, percentile, percentage — do not mix the three
Three similar-sounding numbers cause endless confusion in reports. A z score is a distance in standard deviations (z = 1.28). A percentile is a rank position (the 90th percentile). A percentage in this context is a share of the distribution (90% of values fall below z = 1.28) — numerically the percentile's twin, but a different sentence. And none of them is a percentage score: a student can score 90% on an easy test and land at the 60th percentile, or score 55% on a brutal one and land at the 95th. Percentiles describe standing within a group; raw percentages describe the paper. Our z score vs percentile page works the same result in both languages until the distinction is automatic.
How percentile bands get used in admissions and screening
Cutoffs in the wild are usually percentile statements wearing plain clothes: "top 10% of applicants" is the 90th percentile (z = 1.282), "the bottom quartile is referred for support" is the 25th (z = −0.674), and "two standard deviations below the mean" on a developmental screen is the 2.28th percentile. Converting the announcement into z before you act on it tells you how selective the bar actually is — and whether a near-miss (z = 1.24 against a 1.282 bar) is a rounding question or a real gap.
Frequently asked questions
What percentile is a z score of 1.5?
The 93.32nd percentile — Φ(1.5) = 0.9332. About 93 of every 100 values fall below it, and 6.68% fall above it.
What z score is the 90th percentile?
z = 1.282 (often rounded to 1.28). It is also the one-tailed critical value at α = 0.10 — percentile cutoffs and critical values are the same reverse lookup.
Can a percentile be above 100 or below 0?
No. As z runs from −∞ to +∞, Φ(z) runs from 0 to 1, so percentiles live strictly between 0 and 100. The chart stops at ±3.5 because beyond that the percentiles (0.02 and 99.98) are too extreme to distinguish in practice.
Why does the chart use tenths when the table uses hundredths?
A chart is for orientation: tenths are enough to place a score ("about the 90th percentile"). For exact work — cutoffs, significance, conversions you will quote — use the full table or the calculator, which keep two decimals and interpolate beyond them.
Is the 50th percentile always z = 0?
On the standard normal curve, yes: the distribution is symmetric, so its median equals its mean, and z measures distance from that mean. For skewed real-world data, percentiles and z scores part company — one reason growth charts publish their own conversions.