Z Score Table PDF
Download the z score table as a print-clean PDF — positive table on page one, negative table on page two, critical values on page three — plus PNG images and a CSV of every value. All files are generated from the same cumulative distribution data as the interactive tables on this site, so the printout on your desk can never disagree with the screen.
What is in the PDF
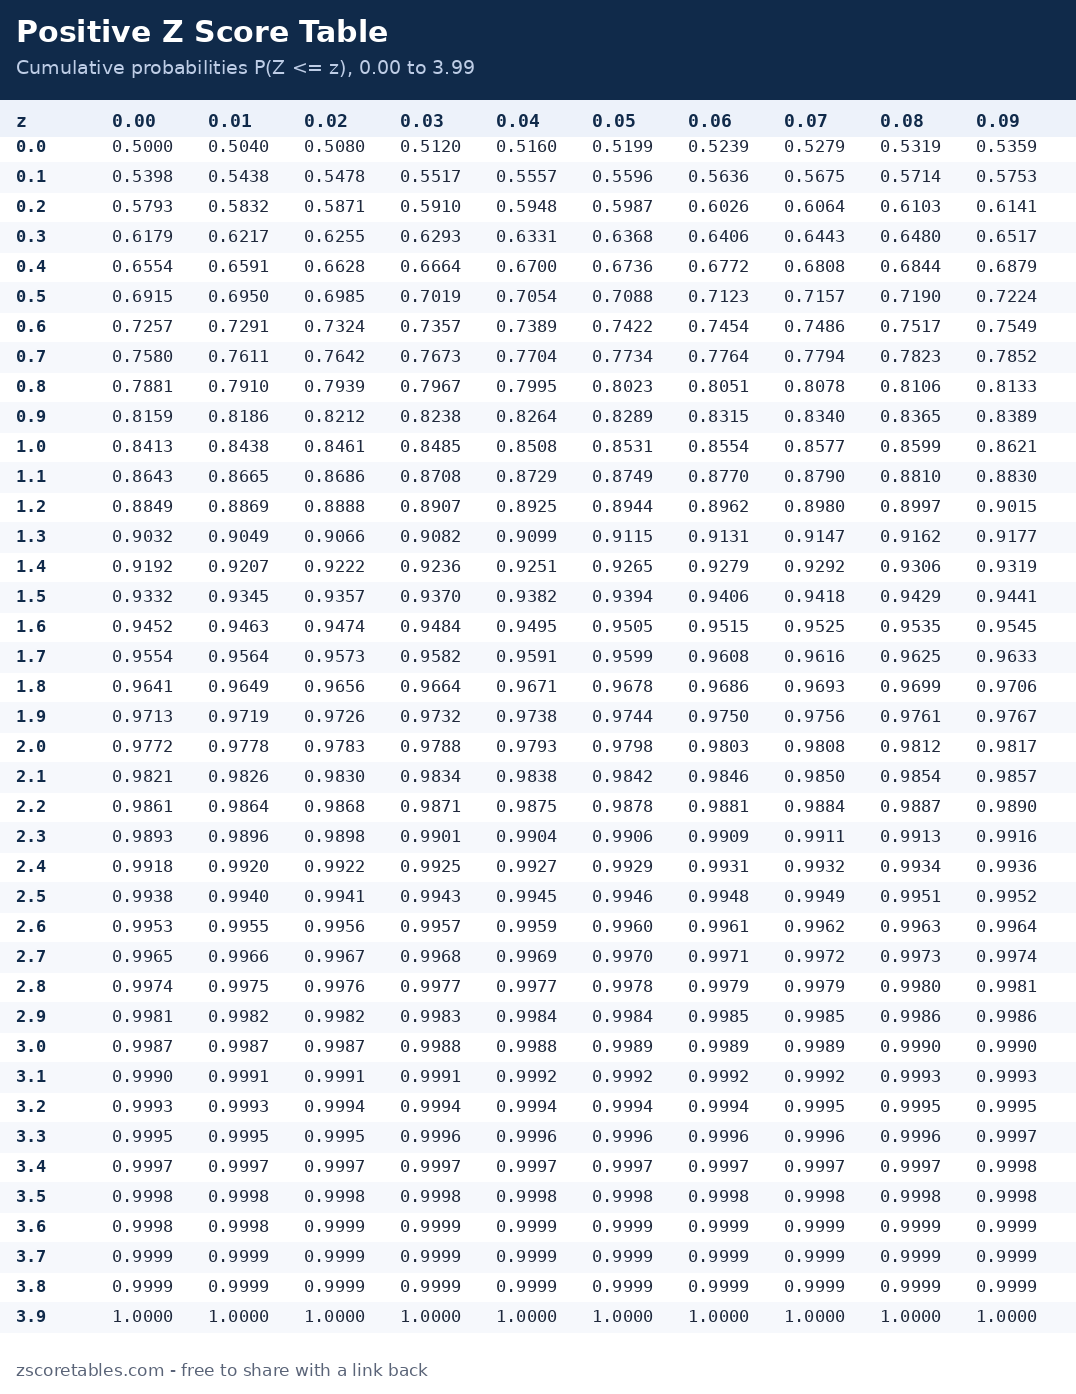
- Page 1 — Positive z score table, 0.00 to 3.99. Cumulative probabilities P(Z ≤ z) in a courier grid that stays legible photocopied — the version to pin above a desk.
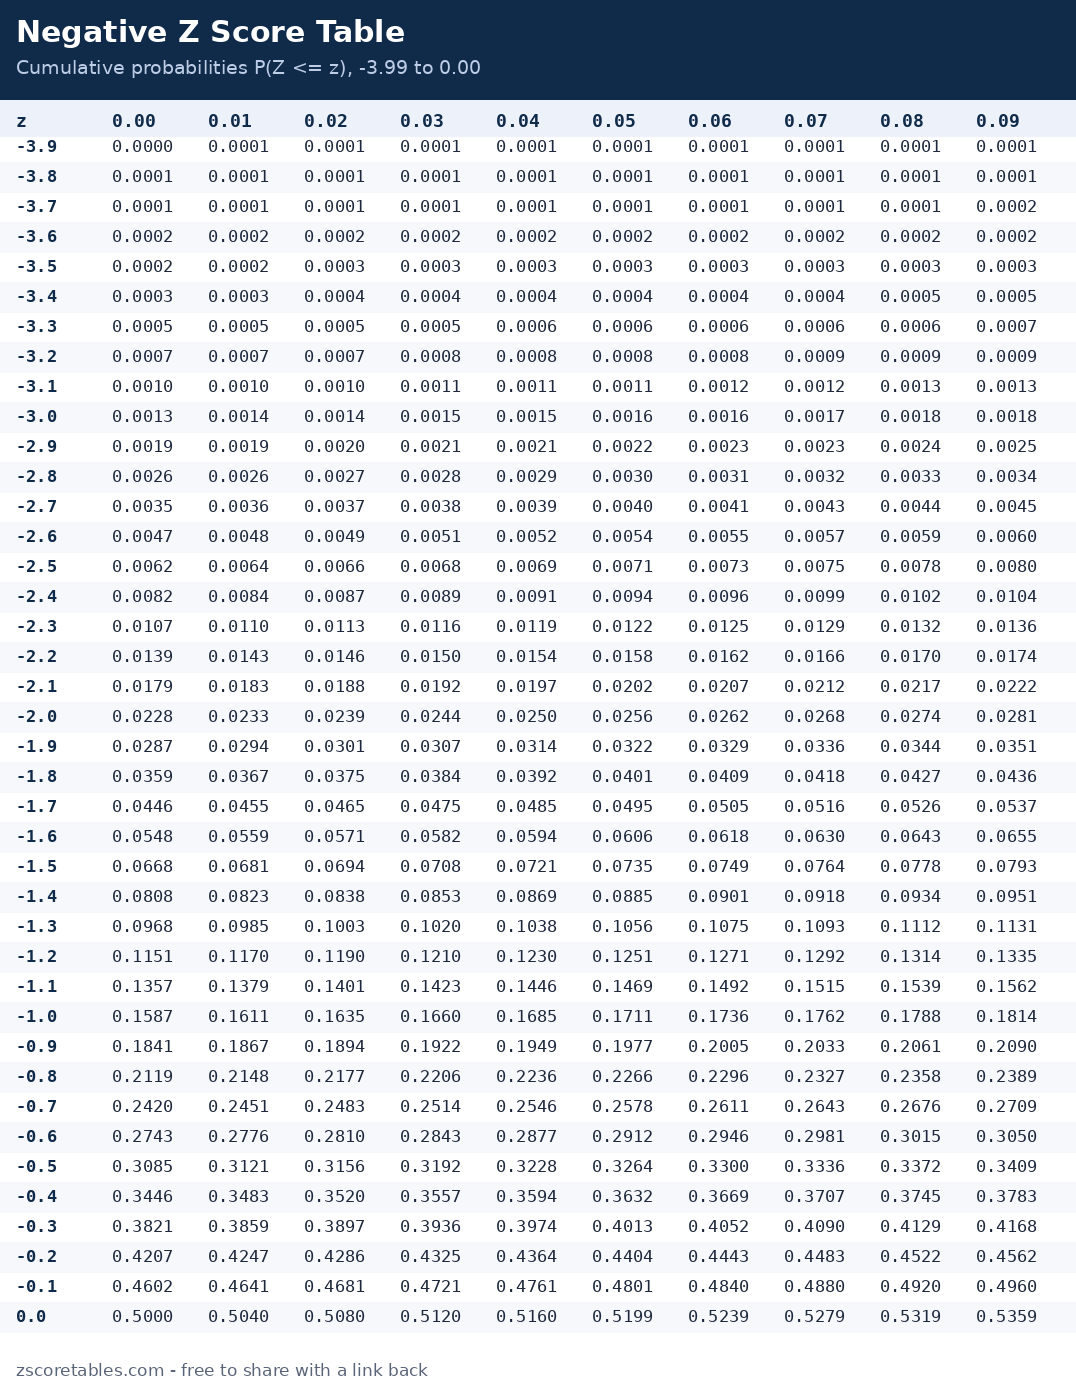
- Page 2 — Negative z score table, −3.99 to 0.00. The half most free PDFs quietly leave out, forcing students into symmetry arithmetic mid-exam. Here it is complete.
- Page 3 — Critical z values and key percentiles. The 80–99.9% confidence rows, one- and two-tailed, plus the landmark conversions (z = 1.645 ↔ 95th percentile and friends).
Every page carries the source line "zscoretables.com — free to print and share with a link back". Teachers: you may copy the PDF into course packs and classroom handouts as-is; the only condition is that the source line stays on the page.
Printing tips that actually matter
- Print from the PDF, not a screenshot. Screenshots resample the grid and blur the fourth decimal — the digit that decides borderline answers.
- Use "actual size", not "fit to page". Fit-to-page shrinks the negative table's dense rows unevenly on some printers; actual size keeps every row the same height.
- Highlight three cells before the exam. Mark 0.9500 (z = 1.645), 0.9750 (1.96) and 0.9950 (2.576) on your printed copy. Most papers reuse these critical values, and finding them in two seconds instead of twenty is a genuine edge.
- On screen instead? Every page of this site has a print stylesheet: open the positive or negative table and print the page itself — navigation and tools disappear, the table prints clean.
Why generated files beat scanned tables
Most z table PDFs circulating online are scans or screenshots of textbook tables, and they inherit every typo those printings ever contained — a wrong fourth decimal in a scan will sit there for decades being copied from site to site. These files are different in kind: a script computes each of the 800 values from the standard normal cumulative distribution function and writes the PDF, the CSV and the PNGs from that single computed dataset. The build then spot-checks known anchors (0.00 → 0.5000, 1.00 → 0.8413, 1.96 → 0.9750, −1.96 → 0.0250, 2.576 → 0.9950) before anything is published. If a value were wrong, it would be wrong identically everywhere and caught by one check — the failure mode of hand-copied tables, where the PDF says one thing and the web page another, is designed out.
Frequently asked questions
Is the z score table PDF free for classroom use?
Yes — free to download, print, and include in course materials and handouts, with the source line kept on the page. No sign-up, no watermark beyond the source line, no page limits.
Does the PDF include both positive and negative tables?
Yes — positive on page 1 and negative on page 2, each covering the full 0.01-step grid to ±3.99, plus a third page of critical values and landmark percentiles.
What is the CSV for?
The CSV lists all 799 z values with their cumulative probabilities for use in spreadsheets, scripts and your own worksheets — the same dataset that generates the site's tables, so you can build exercises and answer keys that match the printed table exactly.
Can I get the table as an image for slides or a blog?
Yes — use the PNG downloads above (positive and negative). They are high-resolution renders with the source line in the footer; please keep that line and link back where the format allows, which is how free resources like this stay free.
How do I know the values in the PDF are correct?
They are computed, not copied, and spot-checked against published tables at the standard anchors before release. If you ever find a discrepancy, email hello@zscoretables.com with the z value and we will verify and fix it publicly — accuracy is this site's whole reputation.
Working online instead? The interactive z score table finds any value in seconds with the row and column highlighted — the PDF is its paper twin.